
We are unpacking content from Bali Business Review on YouTube to surface the hard data behind property performance in Bali. The analysis highlights occupancy trends, average daily rates, channel mix effects, and a free Bali Property Revenue Calculator that helps owners identify revenue shortfalls and opportunities with clear, numerical benchmarks.
Hi, I’m Jason, a Business Journalist at Bukit Vista, and I’ll be unpacking analysis from Bali Business Review. Today, we’ll dive into property performance and revenue optimization in Bali to offer clear, data-driven insights.
Market Context: Demand Patterns and Traveler Behavior in Bali

Bali’s inbound demand has rebounded but remains uneven across segments and seasons. Urban and beachside properties see strong weekend and holiday spikes, while midweek occupancy lags, creating volatility in monthly revenue totals. The distribution of international versus domestic travelers affects length of stay and booking lead times, which in turn alters revenue forecasting and staffing decisions.
Understanding traveler behavior is critical: longer stays shift revenue focus to average daily rate (ADR) management, while short-stay bursts demand dynamic pricing and flexible minimum-night policies. Owners who segment their offering for business travelers, family groups, and digital nomads can tailor amenities and promotions to increase conversion and improve RevPAR throughout the year.
Key market indicators to monitor
- Occupancy by day-of-week and month-over-month trends
- Average daily rate (ADR) and length-of-stay distributions
- Channel mix: OTA vs direct bookings and repeat guest ratios
Identifying Underperformance: Metrics and Red Flags for Property Owners
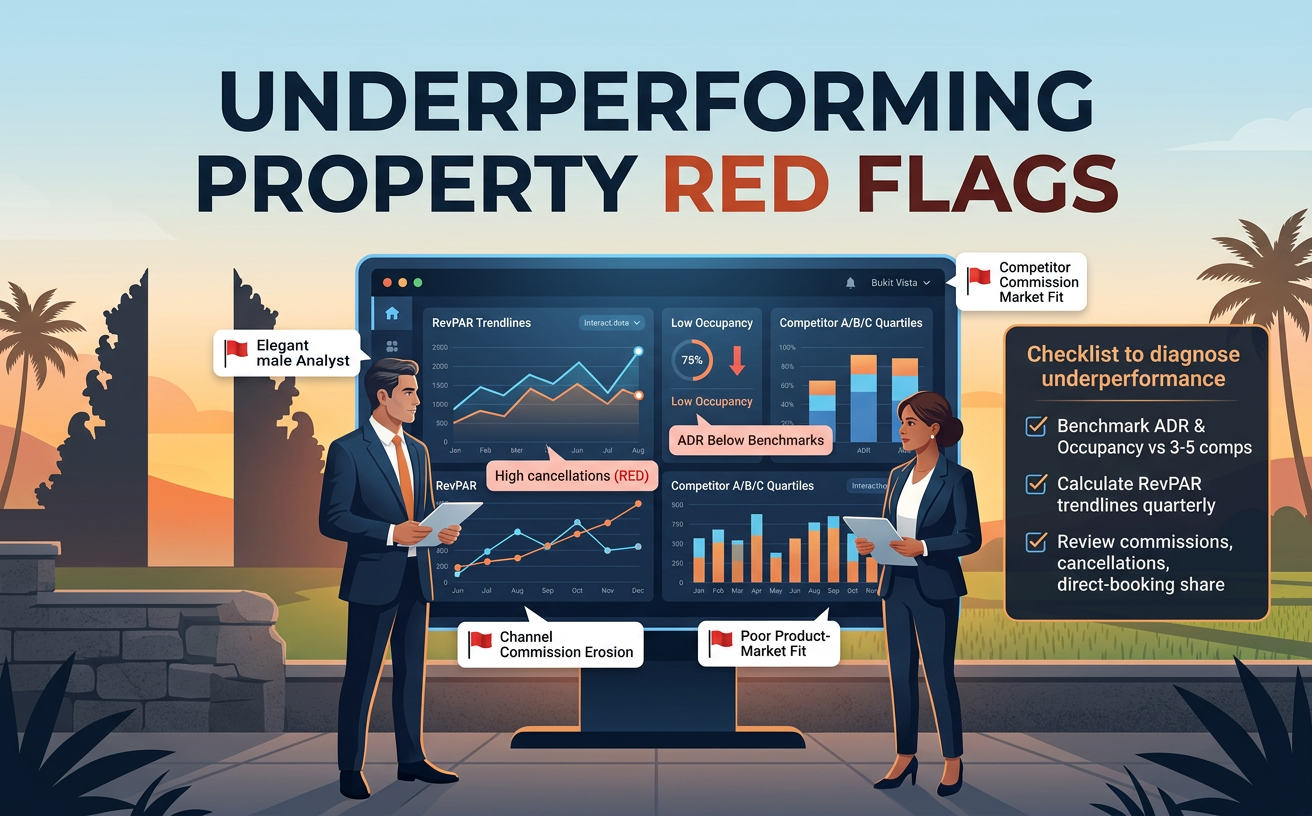
Underperformance often shows up in a few measurable areas: low occupancy relative to comparable properties, ADR below neighborhood benchmarks, and poor channel efficiency where OTA commissions erode net revenue. A common red flag is a high cancellation rate or short lead times that prevent effective yield management. Tracking these metrics monthly, not just seasonally, reveals structural issues versus temporary dips.
Owners should compare their property’s RevPAR (Revenue Per Available Room) and gross operating profit against similar listings in their micro-market. If your property’s RevPAR consistently sits in the bottom quartile for comparable inventory, it indicates pricing, distribution, or product-market fit problems rather than simple market seasonality.
Checklist to diagnose underperformance
- Benchmark ADR and occupancy against 3–5 comparable properties
- Calculate RevPAR and compare trendlines quarterly
- Review channel commissions, cancellation rates, and direct-booking share
Using the Bali Property Revenue Calculator: Practical Steps for Owners
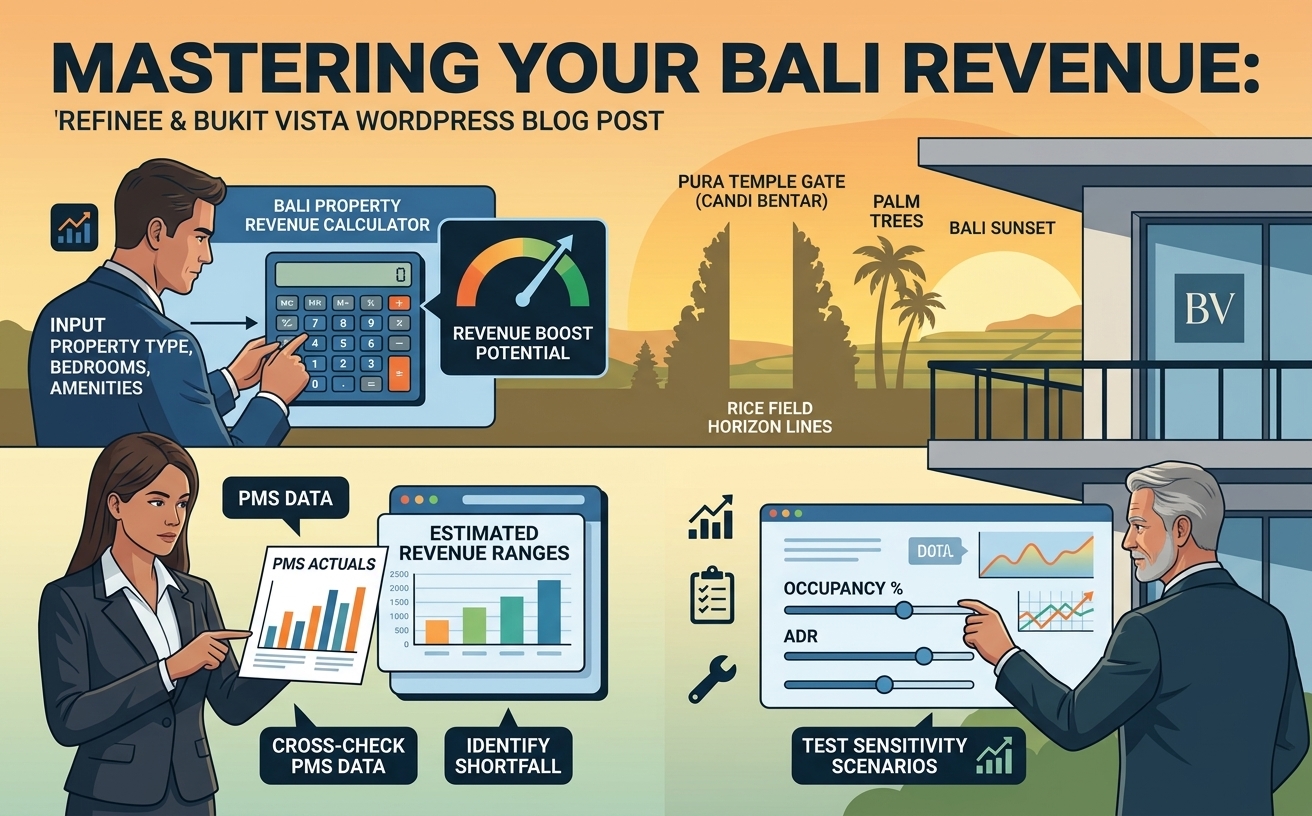
The free Bali Property Revenue Calculator highlighted in the analysis provides an immediate baseline: input property type, area, bedroom count, and typical amenities to generate estimated monthly and annual revenue ranges. This tool helps owners move from anecdote to numbers, identifying whether a shortfall is material or within expected variance. The calculator also shows sensitivity to occupancy and ADR, making it easier to prioritize interventions.
To use the calculator effectively, pair its outputs with your PMS data and recent booking reports. Cross-check suggested benchmarks with actual channel reports and local competitor rates; discrepancies point to either pricing opportunities or distribution inefficiencies that can be addressed through targeted marketing or rate strategy adjustments.
How to get actionable outputs
- Input accurate bedroom count, property type, and location for realistic benchmarks
- Compare calculator results to your last 12 months of actual revenue
- Use sensitivity outputs to test scenarios (higher ADR vs higher occupancy)
Practical Optimization Strategies: Pricing, Distribution, and Product Improvements
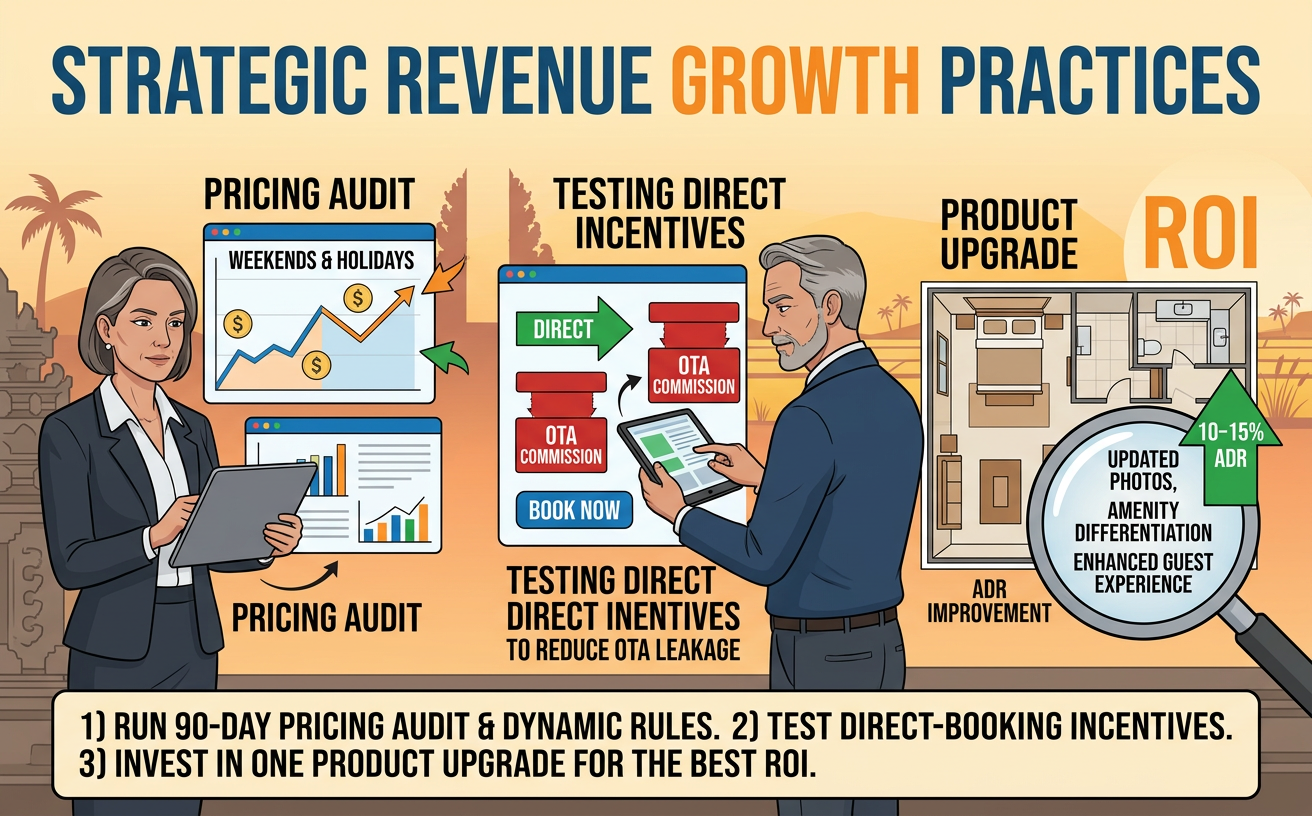
Fixing revenue gaps requires a mix of immediate pricing actions and longer-term product investments. Short-term levers include optimizing minimum-stay rules, implementing dynamic pricing during high-demand windows, and shifting commission-heavy inventory toward direct channels with incentives for guests to book on-site. Medium-term moves involve targeted marketing for underutilized traveler segments like remote workers or extended-stay guests.
Product improvements that drive higher ADR—updated photography, clear amenity differentiation, and enhanced guest experience—tend to have the best ROI when paired with refined channel strategy. Operational efficiencies, such as streamlined check-in and targeted upsells, increase net revenue without solely relying on higher occupancy.
Priority action list for owners
- Run a 90-day pricing audit and implement dynamic rules for weekends and holidays
- Test direct-booking incentives to reduce OTA commission leakage
- Invest in one product upgrade that justifies a 10–15% ADR improvement
Key Takeaways
- Benchmarking against comparable properties is the fastest way to detect true underperformance and prioritize fixes.
- The Bali Property Revenue Calculator offers immediate, data-driven revenue ranges to move decisions from guesswork to evidence.
- Address distribution inefficiencies and OTA commission leakage to improve net revenue without increasing occupancy.
- Combine short-term pricing tweaks with one targeted product upgrade to capture higher ADR and better guest reviews.
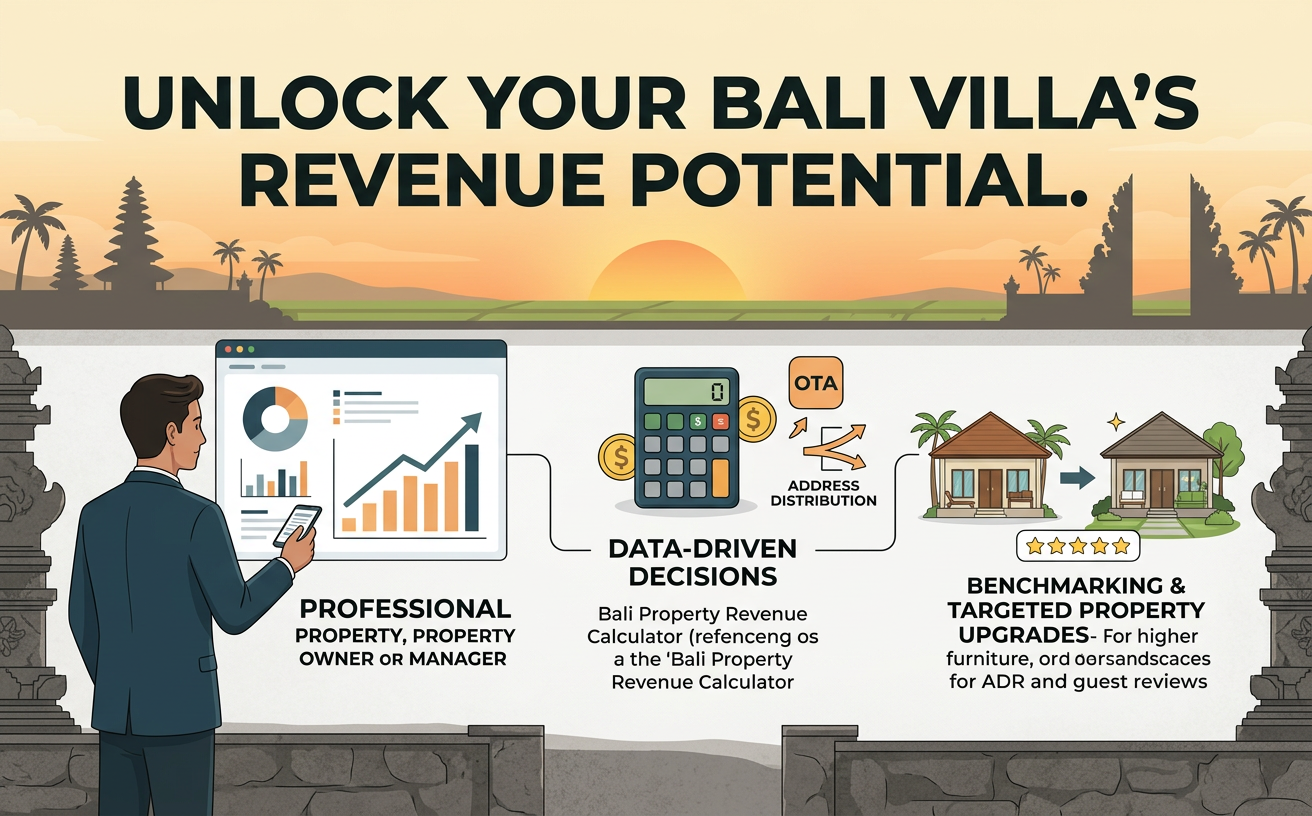
In summary, property owners in Bali can move from uncertainty to action by measuring performance against local benchmarks, using tools like the Bali Property Revenue Calculator, and executing a mix of pricing, distribution, and product strategies. The business impact is straightforward: better data and targeted interventions translate into higher RevPAR and more predictable net income.
Jason, Business Journalist at Bukit Vista
You’re a property owner? Wondering What Could Your Bali Villa Really Earn?
Get a data-driven revenue projection based on your property type, area, and bedroom count. Discover your villa’s true earning potential in Bali.