
We are unpacking content from Bali Business Review on YouTube to examine the factual gap between promised passive income and the real returns property owners experience. The report highlights occupancy, operating costs, management quality, and realistic net yields as primary determinants of performance.
Hi, I’m Jason, a Business Journalist at Bukit Vista, and I’ll be unpacking analysis from Bali Business Review. Today, we’ll dive into The Myth of Passive Real Estate Income to offer clear, data-driven insights.
The reality behind ‘passive’ real estate earnings

The commonly sold idea that rental properties generate steady, hands-off income is challenged by the analysis. Owners frequently conflate gross receipts with net, overlooking recurring costs and required active management. Marketing, guest communication, repairs, utilities, taxes, and seasonality all erode headline rental revenue. As a result, reported annual returns can be materially lower than initial projections unless owners account for ongoing operational demands.
Beyond expenses, local market dynamics matter: demand fluctuations, regulatory changes, and competition can compress both occupancy and average daily rates. In Bali specifically, tourism seasonality and platform-driven pricing volatility mean that short-term rental income is not a fully predictable cash flow. The takeaway is that “passive” should be reframed as “owner-light” only when professional systems and accurate forecasting are in place to preserve margins and reduce owner time commitment.
Why properties underperform: common causes and metrics to watch
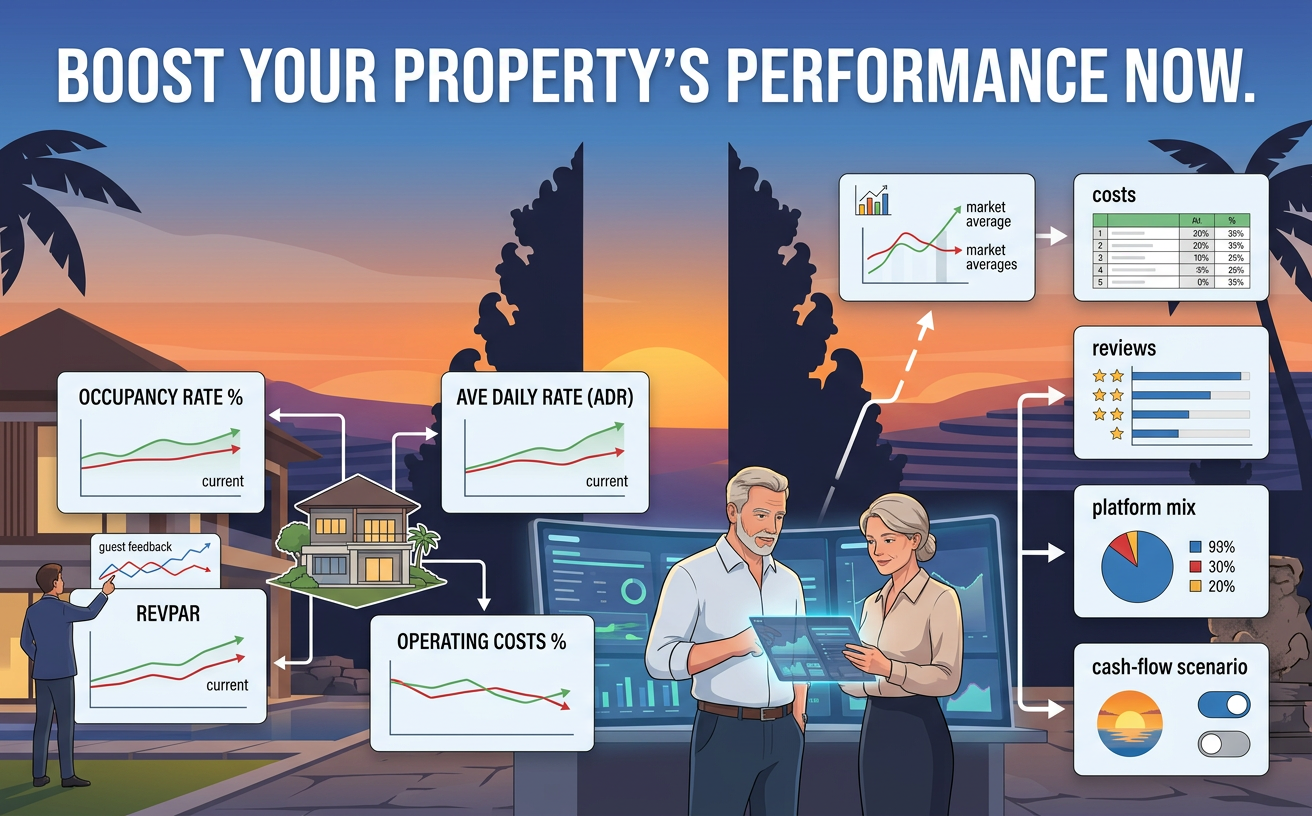
Underperformance is most often the result of three interacting issues: insufficient revenue per available night, elevated operating costs, and substandard property presentation or management. Low occupancy paired with a weak average daily rate (ADR) quickly depresses revenue. Meanwhile rising maintenance, utility bills, and noncompliant tax practices eat into net income. The analysis highlights that owners who do not track standard hospitality KPIs tend to miss hidden drains on profitability.
To diagnose underperformance, track core metrics monthly and quarterly. Occupancy rate, ADR, RevPAR (revenue per available room), platform commission, and total operating expense ratio provide a clear picture of whether a property is meeting market potential. Regular benchmarking against similar properties in the same submarket enables actionable interventions—pricing adjustments, targeted marketing, refurbishment, or management changes—to restore competitiveness and margins.
Checklist for diagnosing underperformance
- Compare current occupancy and ADR to 12-month local averages.
- Calculate total operating costs as a percentage of gross revenue.
- Assess guest feedback trends and identify recurring maintenance issues.
- Review channel mix and commission impacts across booking platforms.
- Run scenario forecasts for low and high season to stress-test cash flow.
Using the Free Bali Property Revenue Calculator to clarify expectations
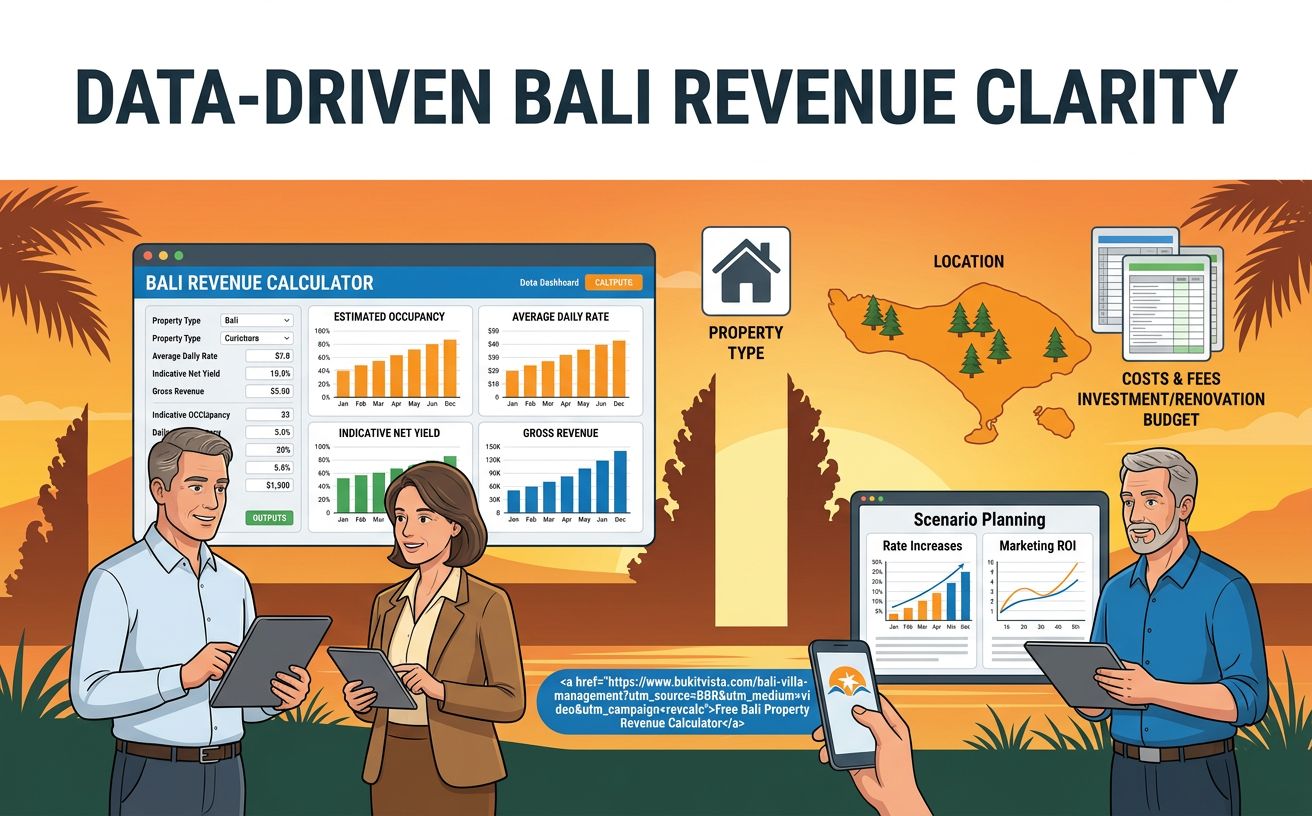
Practical tools can convert uncertainty into actionable numbers. The Free Bali Property Revenue Calculator provides owners with a data-driven projection of potential revenue by combining local market averages, your property’s type and bedroom count, and expense assumptions. By inputting these variables, the calculator produces realistic estimates for occupancy, average daily rate, gross revenue, and an indicative net yield—helping distinguish optimistic projections from evidence-based expectations.
Beyond headline estimates, the calculator supports scenario planning. Owners can simulate interventions such as rate increases, occupancy improvements from marketing investments, or upgrades that justify higher ADR. This enables prioritization of capital expenditures with expected payback timelines and clearer discussions with property managers or prospective buyers. For Bali owners, the tool is especially valuable because it uses regionalized assumptions that reflect seasonality and platform dynamics unique to the market.
What to include when using the revenue calculator
- Property type (villa, apartment, guesthouse) and precise bedroom count.
- Location or submarket within Bali to capture local demand patterns.
- Current average nightly rate and typical occupancy observed.
- Estimated annual operating costs, including management fees and utilities.
- Desired investment or renovation budget for scenario testing.
Access the calculator here: Free Bali Property Revenue Calculator.
Key Takeaways
- Passive income from property is rarely fully passive: realistic net returns require active oversight or professional management.
- Measure performance with hospitality KPIs—occupancy, ADR, RevPAR, and operating cost ratio—to identify underperformers quickly.
- Underperformance is correctable: targeted improvements in pricing, presentation, and channel strategy can reclaim lost revenue.
- Use regional tools like the Free Bali Property Revenue Calculator to generate evidence-based revenue and expense forecasts before making decisions.
- Scenario planning helps prioritize investments and sets accurate owner expectations about time and capital required.
Final word: reframing expectations from “passive” to “managed” income shifts decision-making toward measurable actions. For Bali property owners, combining disciplined KPI tracking with data tools and quality management transforms uncertain projections into reliable revenue strategies.
Jason, Business Journalist at Bukit Vista
You’re a property owner? Wondering What Could Your Bali Villa Really Earn?
Get a data-driven revenue projection based on your property type, area, and bedroom count. Discover your villa’s true earning potential in Bali.