
Unpacking recent coverage from Bali Business Review on YouTube, this report highlights a striking paradox: international flight numbers and arrivals are climbing while many beaches and tourist sites remain noticeably quiet. We focus on the underlying data, short-term demand patterns, and what these dynamics mean for villa owners and potential investors.
Hi, I’m Jason, a Business Journalist at Bukit Vista, and I’ll be unpacking analysis from Bali Business Review. Today, we’ll dive into Bali’s Economic Mystery: More Flights, Empty Beaches to offer clear, data-driven insights.
Flight Growth vs. Empty Beaches: The Paradox Explained

Recent data shows a clear uptick in scheduled flights and available seats into Bali hubs, yet many iconic beaches and attractions report lower-than-expected footfall. The apparent mismatch arises from a combination of shorter layovers, an uptick in same-day transit passengers, and a dispersal of tourists into non-traditional neighborhoods and private villa enclaves rather than concentrated beach zones.
Seasonality and geographic distribution are central to this divergence: flights arrive from a wider set of origin cities, bringing fragmented demand that does not uniformly convert into overnight stays in classic tourist precincts. Additionally, domestic leisure patterns and tighter travel budgets mean visitors may prioritize lower-cost or alternative experiences, leaving high-profile beaches quieter than arrival numbers alone would predict.
Key contributing factors
- Higher frequency routes bringing transit and day-trip traffic rather than extended stays.
- Redistribution of tourists to emerging neighborhoods, rural attractions, and private villas.
- Changes in traveler behavior: shorter trips, budget constraints, and diverse activity preferences.
- Seasonal and event-driven spikes that concentrate visitors for short periods, then subside.
What This Means for Villa Investors and Property Performance

For villa owners, higher arrival counts do not automatically translate into stronger occupancy or revenue. Key performance metrics — occupancy rate, average daily rate (ADR), and RevPAR — depend on the converting power of arrivals into real overnight demand and on targeted marketing to the right guest segments. Investors who rely on headline arrival statistics risk overestimating achievable revenue without granular, property-level analysis.
Operational costs and financing conditions remain fixed pressures while guest profiles shift toward shorter stays and more budget-conscious travelers in some markets. Effective revenue management, dynamic pricing, and targeted distribution strategies (direct bookings, curated OTA presence, and partnerships with long-stay platforms) become essential to protect margins and avoid negative ROI on investments made under different market assumptions.
Checklist for investors assessing current performance
- Compare local occupancy and ADR against arrival growth for the same catchment area.
- Review guest length-of-stay trends and adjust minimum stay and pricing rules accordingly.
- Audit distribution channels: ensure a balance between OTAs, direct site, and long-stay platforms.
- Model sensitivity to seasonal swings and short-notice cancellations in financial projections.
How to Gauge Property Performance and Use the Bali Property Revenue Calculator
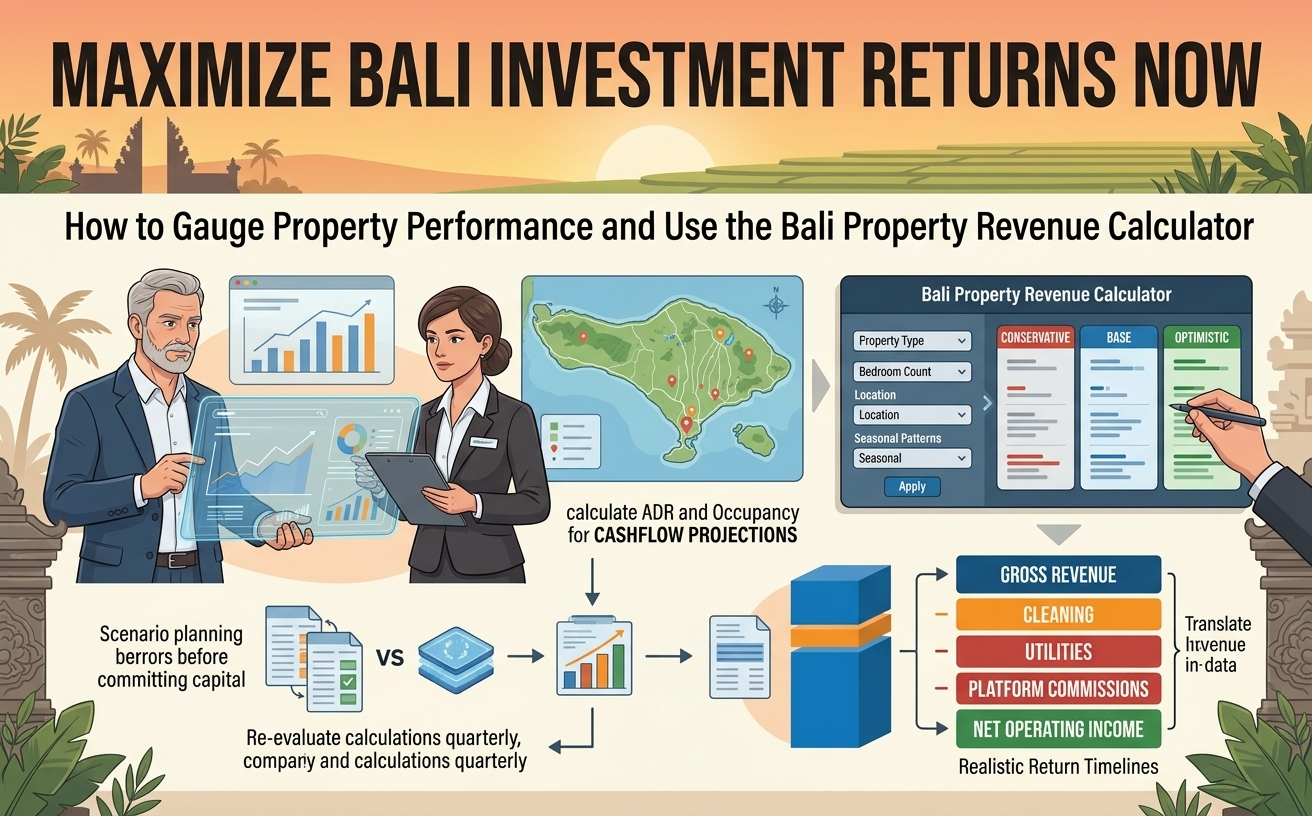
Estimating realistic revenue starts with market-driven inputs: property type, bedroom count, location, and seasonal demand patterns. The free Bali Property Revenue Calculator referenced in the coverage uses aggregated Bali market data to generate instant revenue projections tailored to villa owners and investors, enabling scenario comparison before committing capital.
Interpreting outputs requires translating calculated occupancy and ADR into cashflow projections and stress-testing them against higher vacancy scenarios or slower recovery in specific neighborhoods. Use the tool to run optimistic, base, and conservative scenarios, and complement those projections with operational detail — cleaning, staffing, utilities, platform commissions — to derive net operating income and realistic return timelines.
How to interpret and act on calculator results
- Run three scenarios: conservative, likely, and optimistic to understand variance in returns.
- Factor in fixed and variable costs to convert gross revenue into net operating income.
- Use the results to set marketing budgets, minimum stay rules, and channel priorities.
- Re-evaluate projections quarterly as local demand patterns and flight schedules evolve.
Key Takeaways

- Rising flight numbers do not guarantee proportional increases in overnight stays or villa bookings; convertibility matters.
- Investors must rely on property-level data (occupancy, ADR, RevPAR) rather than headline arrival statistics to avoid negative ROI.
- Revenue management and distribution strategy adjustments are essential in a fragmented demand environment.
- Use data-driven tools, like the Bali Property Revenue Calculator, to model multiple scenarios and stress-test investments.
- Quarterly reassessment of market inputs and localized performance metrics will protect margins and inform smarter buy/sell decisions.
Final word: Bali’s current paradox—more flights yet quieter beaches—underscores the importance of granular, data-led analysis for property investors. Treat arrival figures as a starting signal, not a forecast; combine them with occupancy trends, guest behavior analysis, and scenario-based revenue modeling to make defensible investment decisions in Bali’s evolving market.
Jason, Business Journalist at Bukit Vista
You’re a property owner? Wondering What Could Your Bali Villa Really Earn?
Get a data-driven revenue projection based on your property type, area, and bedroom count. Discover your villa’s true earning potential in Bali.